
Ever used Django with App Engine? How about the Datastore? Well, if you didn’t Potato actually developed an in-house solution called Djangae that makes Django play nicely and almost seamlessly with the Datastore via its ORM. As if you are writing an app that’ll work with a SQL database, except you don’t.
If you go down that road, how do you figure out why a piece of Django code is slow? This brings us to Appstats.
What is Appstats
Appstats is a profiling library that comes together with the App Engine SDK. Its only purpose is profiling RPC performance of apps. The App Engine Remote Procedure Calls include:
- Datastore calls (
Datastore.Get,Datastore.Put, etc) - Memcache calls (
memcache.get,memcache.set, etc) - URL Fetches
- Mail sends
Why do you need it
Django offers a lovely ORM to abstract our code from a specific database. It has tremendous benefits and (at least) one big drawback. It hides the complexity of database queries. It’s easier to make a very expensive query (or make it even multiple times during a request) without realizing it. That’s why profilers exists: find out why an app is slow.
There is a popular library called django-debug-toolbar. It shows developers the raw SQL queries and the time it took to perform them. Unfortunately it’s rather useless when it comes to profiling an App Engine app - remember there is no SQL. But thanks to App Engine developers, we have Appstats.
How to use it
It’s actually incredibly simple. To enable Appstats you need to update only 2 files:
# settings.py
MIDDLEWARE_CLASSES += (
  'google.appengine.ext.appstats.recording.AppStatsDjangoMiddleware',
)
# app.yaml
builtins:
- appstats: onThis is optional, but highly recommended:
# appengine_config.py
appstats_MAX_STACK = 50
Since Django is a multi-layered framework, some of the calls recorded by Appstats can have very deep stacks, so the default value of 10 won’t be enough to reach our own code. You’ll see for yourself soon.
Appstats console
Once the middleware and the builtin are enabled, you can view the Appstats console at http://127:0.0.1:8000/_ah/stats/. If you bother, this URL can be changed.
Welcome to the ’90s!
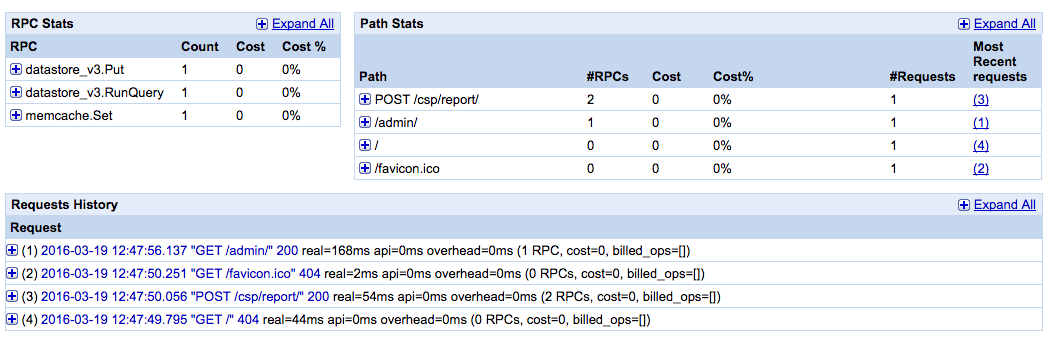
As you can see there are 3 components of the console:
- RPC Stats - it will tell you how many of each RPC calls are made overall.
- Path Stats - how often you’ve hit a specific URL.
- Requests History - all the requests that were made once you’ve started your server, the most recent being on the top.
Let’s focus on the Requests History - this is where the fun part is. From this list
you can already see plenty of interesting information. Every request has a short
summary: real=410ms api=0ms overhead=2ms (17 RPCs, cost=0, billed_ops=[]). It
shows the total request time 410ms, the overhead 2ms of recording this
request (Appstats does come with a little cost) and total number of RPC calls
that were made during this request - 17 RPCs.
Click on either of the requests from Request History list and you’ll see this:
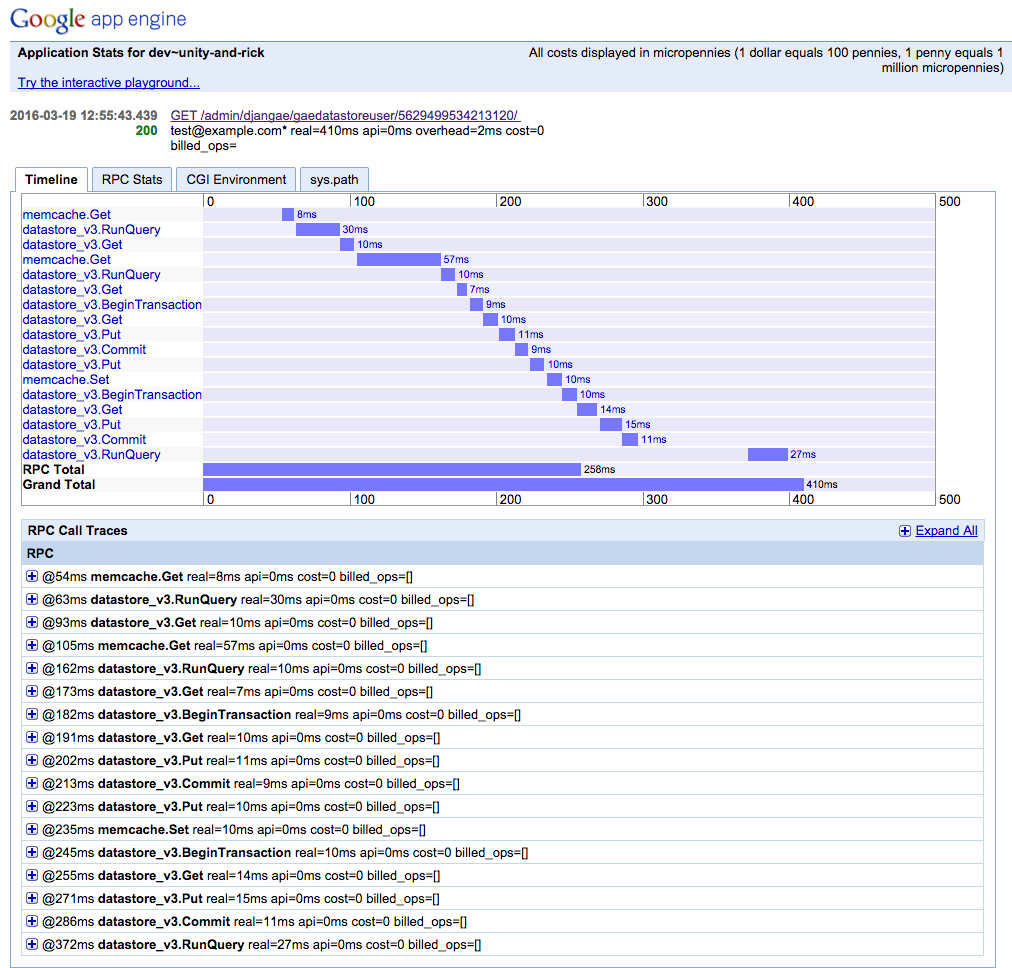
This particular example is boring, because I’m making a request to Django admin.
But still this looks very helpful. You can instantly see the most expensive RPCs here.
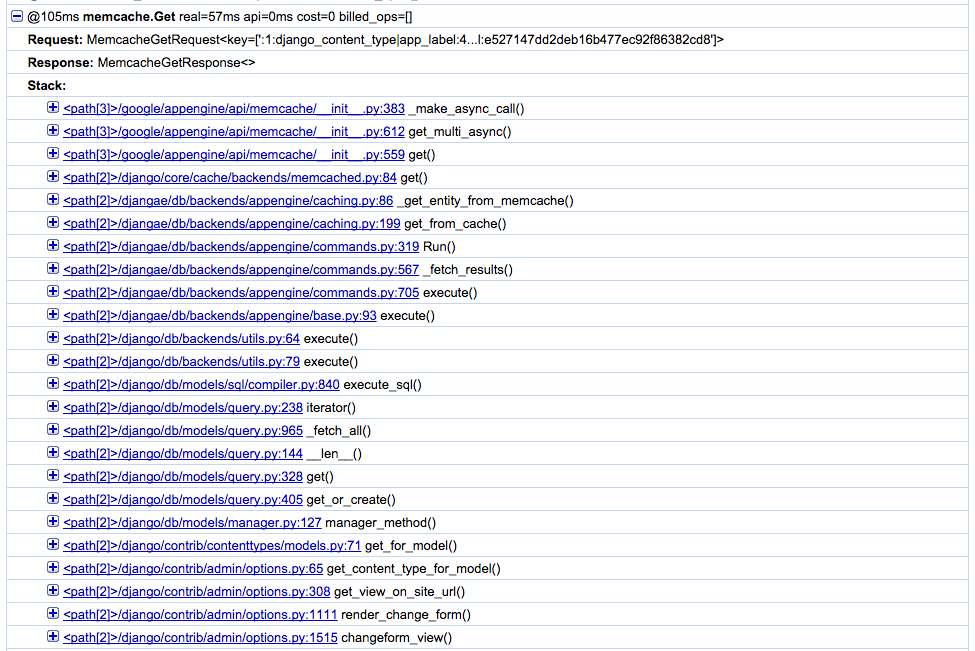
If you expand an item by clicking on little + button
or directly on the rectangle from the timeline, it will show you the full stack.
There are more than 10 lines there, right? Enough to actually go
beyond the googleappengine and django code, and get to your app’s codebase
(not in this case, since no custom code is involved) -
because that’s where most probably stuff is slow. Thank you appstats_MAX_STACK!
Once you are there, inspect the code. Maybe you are making a terribly expensive query or you are writing too often to memcache (without a good reason), or you are not fetching from memcache when you should be, or you are creating a hell lot of deferred tasks, or… there can be lots of reasons!
Can I use it in production?
You could, if you want to identify a problem that is production specific, but no real reason to leave it enabled, because Appstats will only store the last 1000 requests. Moreover they have that tiny overhead. In conclusion, use Appstats extensively during development and only occasionally on production.
Happy profiling!